Opening hours Gallery closed until 7 February, 6pm Café open: Tuesday and Sunday: 10am–4pm, Wednesday to Saturday: 10am–5pm.

Workforce demographics

Workforce demographics

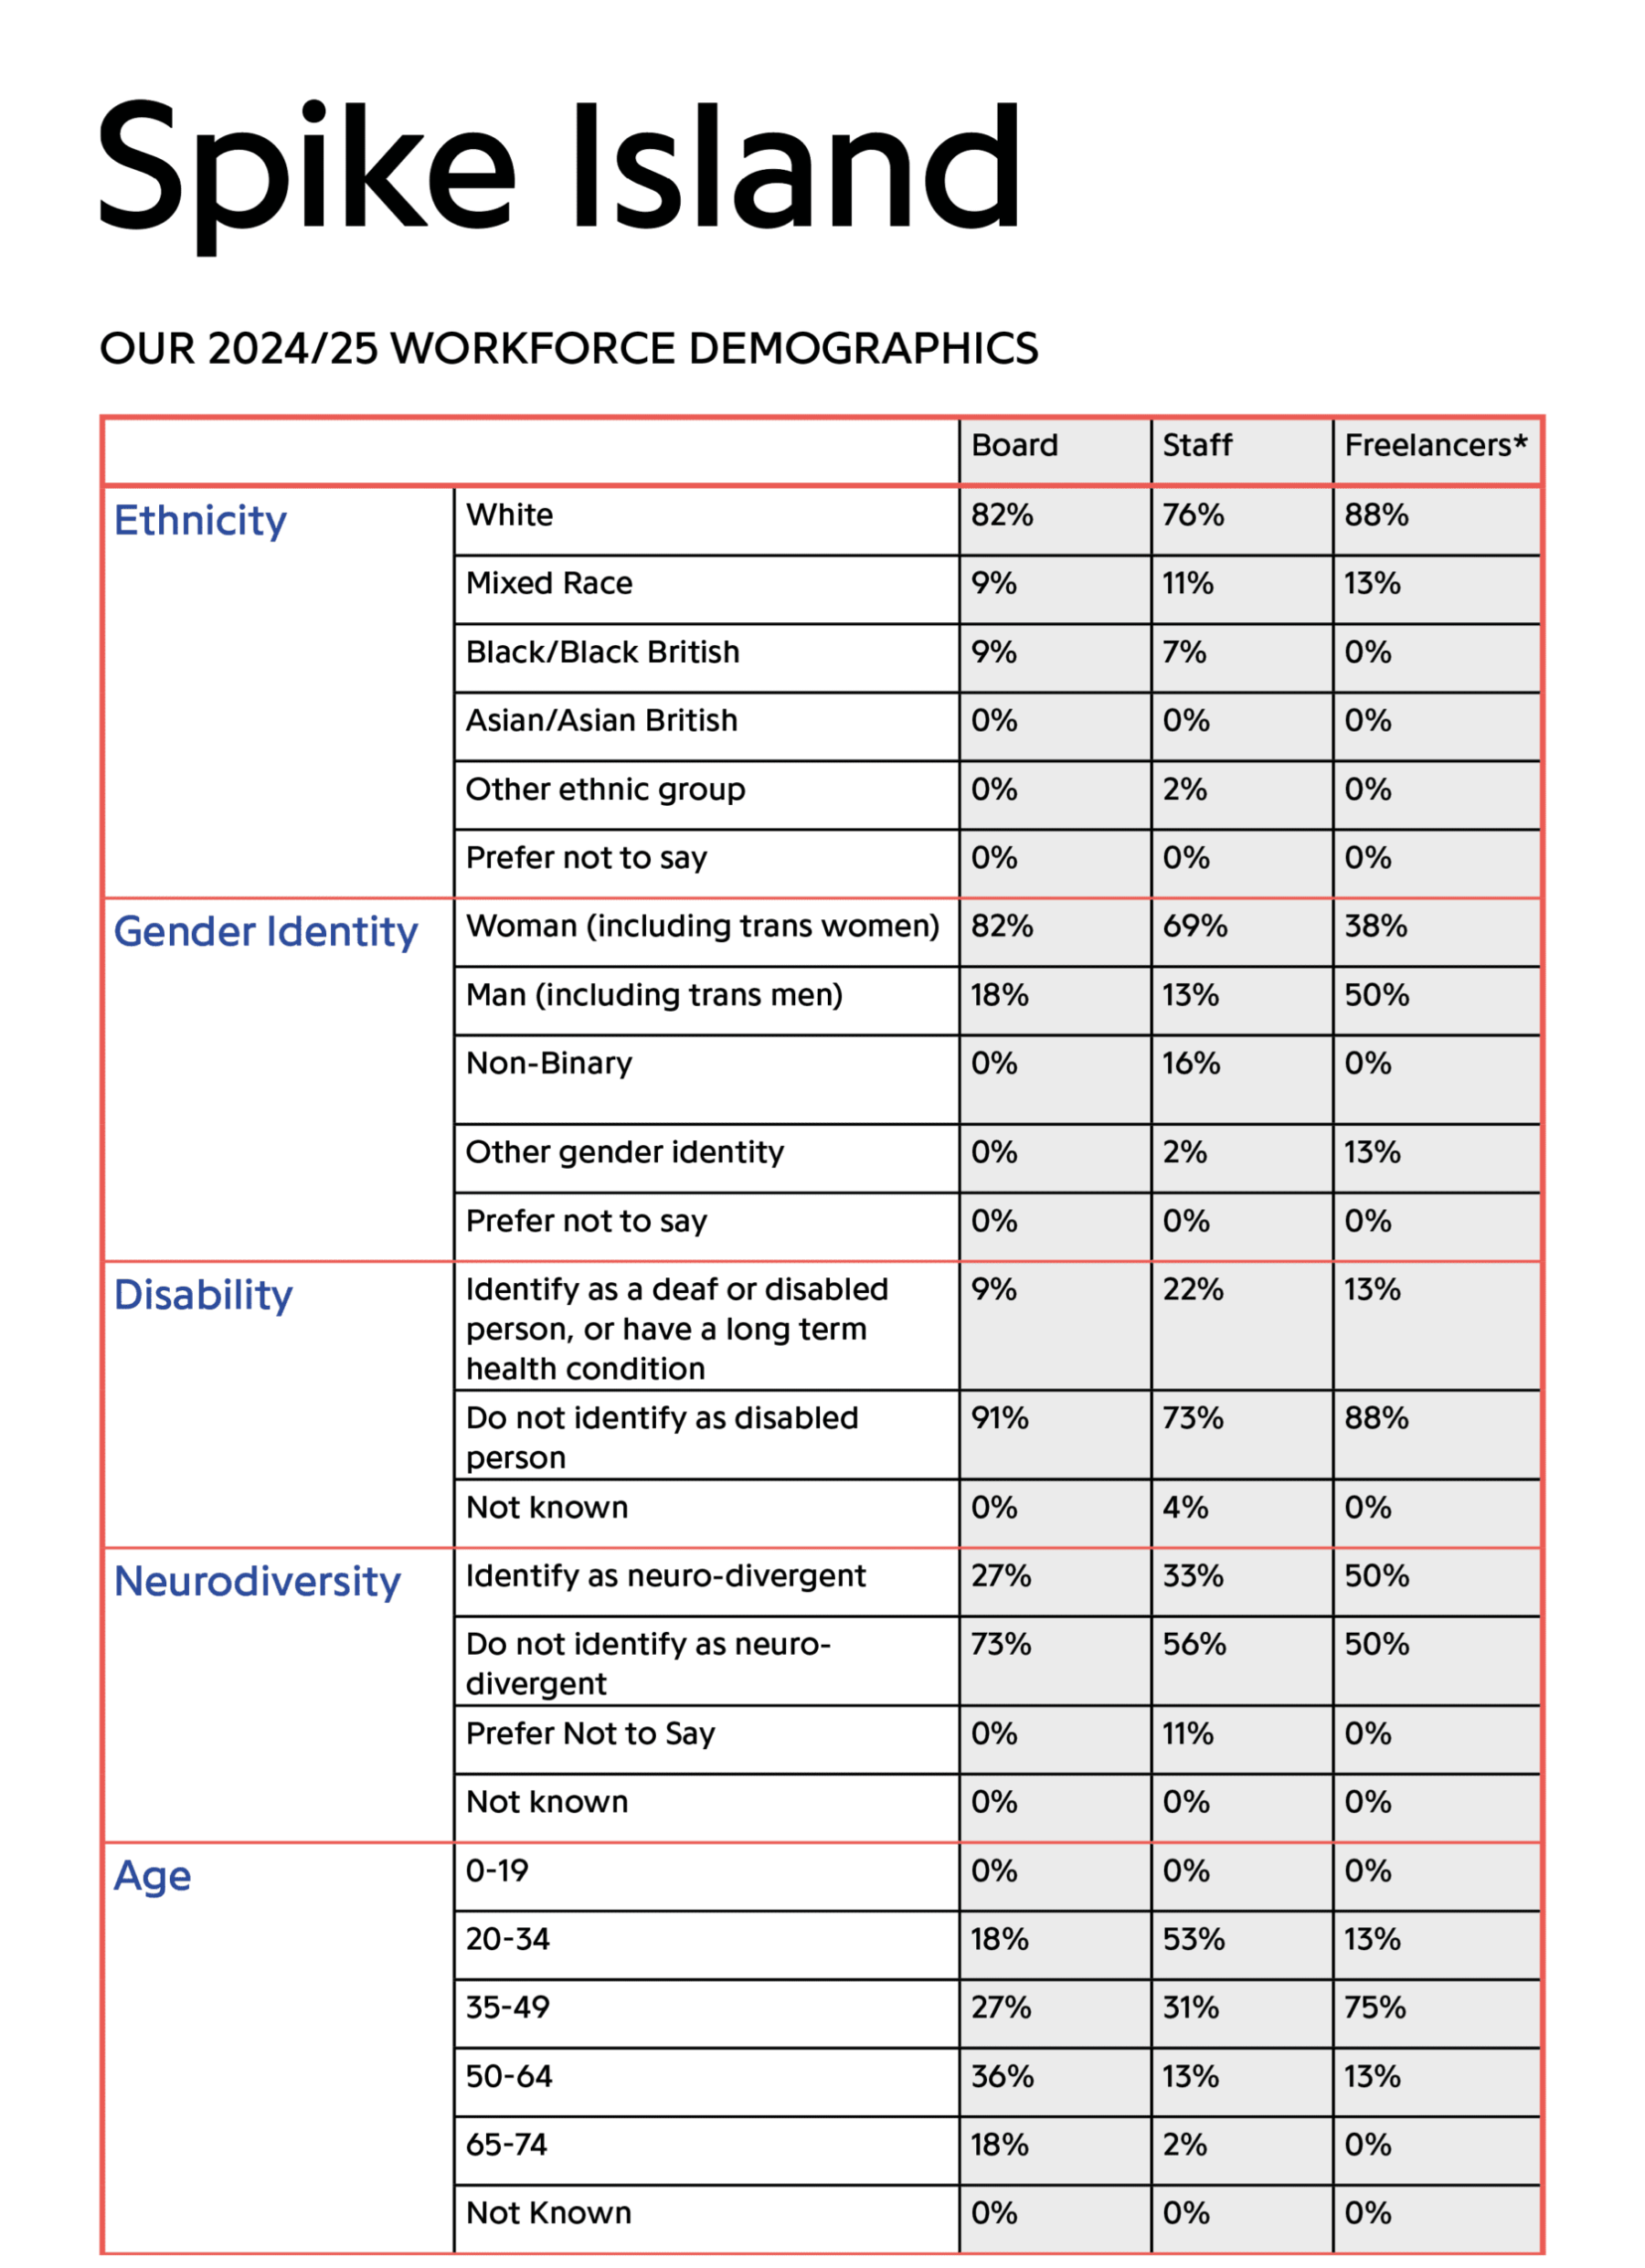
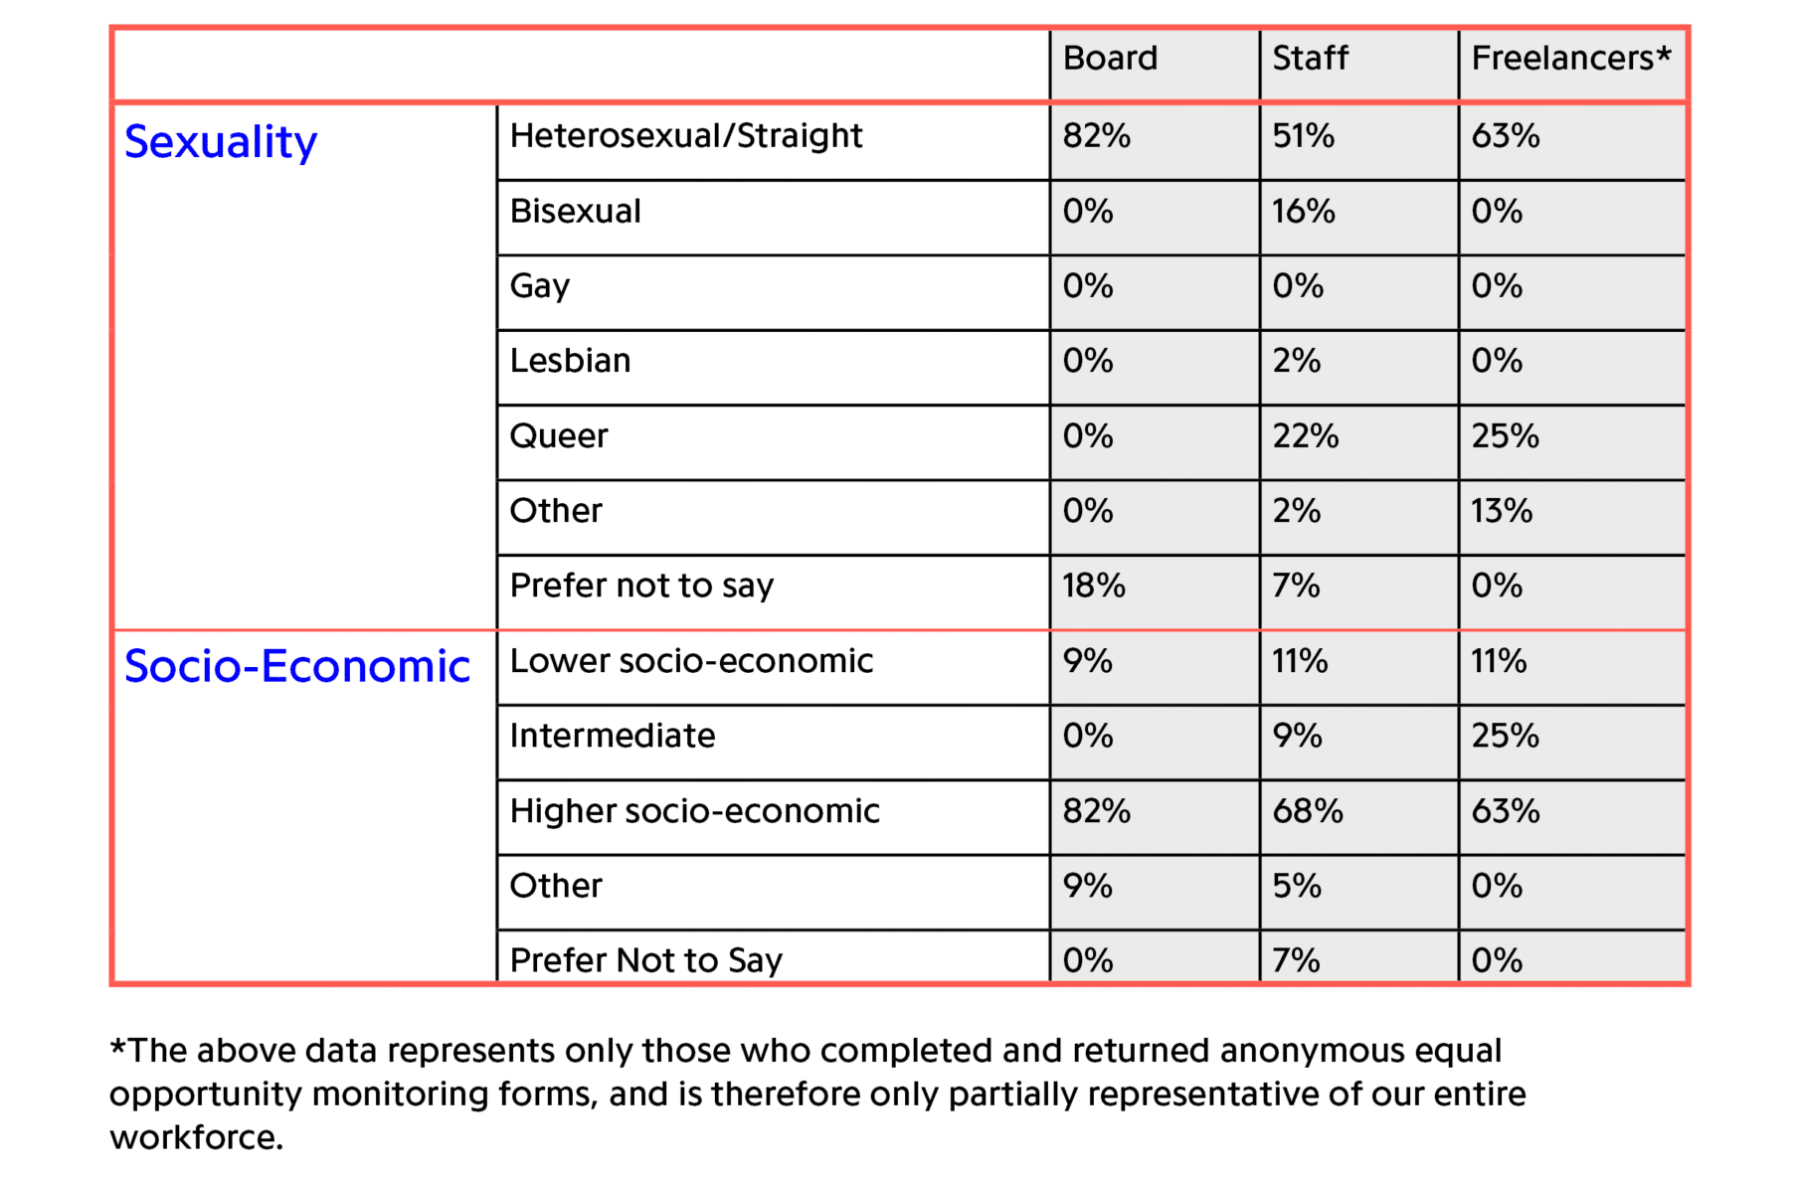
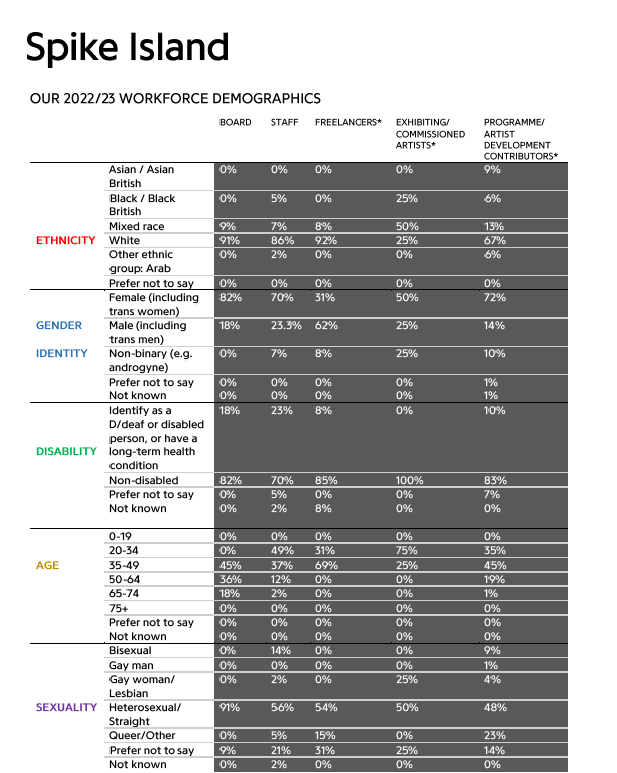
The work we do at Spike Island benefits greatly from the range of perspectives and skills that having a diverse team brings. We believe our staff should reflect the variety of identities and experiences in Bristol, and we are actively engaging in ways to make our recruitment processes more inclusive for all.

In 2022, we became a Disability Confident employer, which included working with WECIL (West of England Centre for Inclusive Learning) to review our recruitment policies and the accessibility of our building. We also developed an Equality, Diversity and Inclusion taskforce that meets regularly throughout the year to discuss and implement organisational changes that focus on underrepresented groups in the sector and reinforce our commitment to anti-racism.

As part of this, we have committed to publicly sharing our Workforce demographics data annually so that any changes in our workforce can be seen.

Last updated: November 2023

Next update: November 2024

2022/23 Workforce Demographics Summary

  • Our 2022/23 Board of Trustees data shows low diversity across all areas, although these figures do not reflect the recruitment of five new Trustees so far in early 2023–24. Our present Board makeup is 79% White British, 7% Mixed: White & Black Caribbean, 14% Black/Black British: Black African; 13% identify as D/deaf or disabled or have a long-term health condition; 79% female, 14% male and 7% non-binary; Ages are relatively mixed including 14% under 34 years old, 43% aged 35–49, 36% aged 50 –64 and 7% aged 50 –64; 79% are heterosexual/straight and 21% prefer not to say; 79% are of higher socio-economic backgrounds while 7% are lower, 7% are intermediate and 7% other.
  • Although our team of Staff team have some diversity in ethnic background, the majority (86%) identify as White British, which does not reflect our programming or the demographics of our city. Like many arts organisations, our workforce is dominated by women, with only 30% identifying as male or non-binary. 23% of our workforce identify as D/deaf or disabled, or having a longterm health condition. Three-quarters of our staff come from higher socio-economic backgrounds, demonstrating the need for us to continue our work in recruiting candidates from different backgrounds and with more diverse lived experiences.  
  • Our small team of Freelancers (mostly technicians who work on our exhibition installations) are not diverse in ethnic background (92% White British) but are increasingly diverse in gender identity, with 31% identifying as female and 8% as non-binary. Only 8% identify as D/deaf or disabled or having a longterm health condition. Representation of lower socio-economic backgrounds within our Freelance workforce is 31% (higher than any other area of our workforce).
  • Our Exhibiting/Commissioned Artists are increasingly ethnically diverse with 50% of respondents identifying as Mixed: White & Black Caribbean and 25% identifying as Black/Black British: Black African. In terms of gender, the programme remains dominated by those who identify as female (50%) but also includes representation of non-binary artists (25%). Half of the Exhibiting/ Commissioned Artists reported lower socio-economic backgrounds (an increase on the previous year at 11%), with the other half identifying as from higher socioeconomic backgrounds.  
  • The ethnic backgrounds of our Public Programme Contributors are consistent with 2021/22, with only 6% identifying as Black/Black British, 13% as Mixed: White & Black Caribbean, and 6% Other Ethnic Group: Arab. The data shows a slight decrease in those who identify as a D/deaf or disabled person, or have a longterm health condition (10%). In terms of gender identity, respondents identify as female in the majority (72%) and are also from higher socio-economic backgrounds in the majority (71%), while only 19% are from lower and 3% intermediate socio-economic backgrounds. 

2022/23 Workforce Demographics Data